Please leave us your feedback using this short Google form: https://forms.gle/E1o364SiohgZHt8Z8
FAQ
General Information
What is a Variable Star?
If you step outside on a dark night and look up at the sky, the vast, vast majority of the stars you see will not change over the course of your lifetime. But a small fraction of those stars exhibit brightness changes that we can actually observe (on timescales of years or days, or even in some extreme cases just a few minutes).
These stars with changing brightness are called variable stars. Variable stars are immensely important for our understanding of the Universe (they reveal things like: how stars are born, evolve, and die; and also provide a way to probe distant galaxies as well).
What is ZTF?
Stellar Sleuths studies variable stars that are found by the Zwicky Transient Facility (ZTF). ZTF is named after Fritz Zwicky. ZTF is a time-domain astronomical survey that uses an ultra-wide-field camera to repeatedly image the same locations in the night sky. The camera is located on the 48-inch telescope on Palomar Observatory in southern California.
Every night ZTF looks at millions upon millions of stars. The vast majority have the same appearance every time the telescope looks at them, but a small fraction (around 1%) can be observed to change over timescales of minutes up to years. The large camera and modern electronics make ZTF one of the most prodigious machines ever created for the discovery of variable stars. The aim of Stellar Sleuths is to classify these stars so we can use them to better understand the Universe!
Light Curves
What is a Light Curve?
A light curve displays measurements of a star's brightness as a function of time. Such plots are very useful for identifying variable sources – variables exhibit changes in brightness that are significantly larger than the uncertainties on individual observations. Here is an example:

Why are there different colors?
The different colors represent different filters. These filters go in front of the camera on the telescope and change the appearance of the light that is detected. Filters only allow light of a certain color to reach the detector (for example, in ZTF there are three filters: the g-band, i.e., green light, the r-band, i.e., red light, and the i-band, i.e., infrared light). Observations in different filters are shown with different symbols and colors. Comparing the variations in each filter can be helpful in determining the type of variable star.
What is a Phase-Folded Light Curve?
Because we observe the stars roughly once every night, it is nearly impossible to see any characteristic variations in the raw data. There are several reasons why:
- Observations are limited to night time, so the sequence is interrupted every morning once the Sun comes up
- The stars that are visible in the summer are different than those in the winter because the Earth has orbited to the opposite side of the Sun,
- Observational sequences can be interrupted by "targets of opportunity." When something important happens, such as a gravitational wave detection, we want to try and identify any light from the event with the telescope.
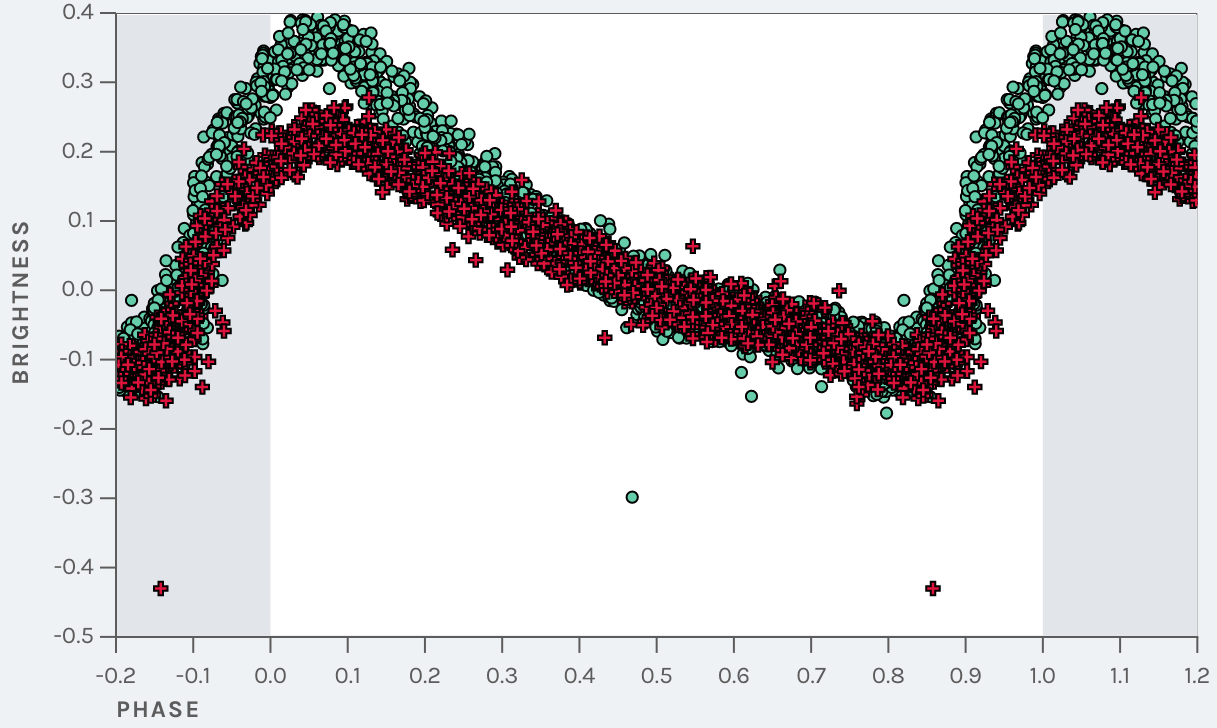
All told, in many cases it is difficult to characterize a star from the raw light curve (shown above). It is easier to see what is going on following a process called phase folding. Using mathematical algorithms, we determine the most likely period(s) of variation for a star (even if it isn't truly periodic, the algorithm always finds a period, this is why we sometimes need help determining which stars are truly periodic). With this period, we collapse the raw data down to where it would be in each period of oscillation. This means, if a star is brightest at a phase of 0.5, then every observation which corresponds to that peak will line up together.
Below is an example "phase-folded" light curve (this is the same star whose light curve is shown above). Using the best-fit period we "fold" the observations to "line up" in phase space, in other words, we have aligned it based on the phase corresponding to every observation.
Control Panel
Control Panel: PERIOD MULTIPLE
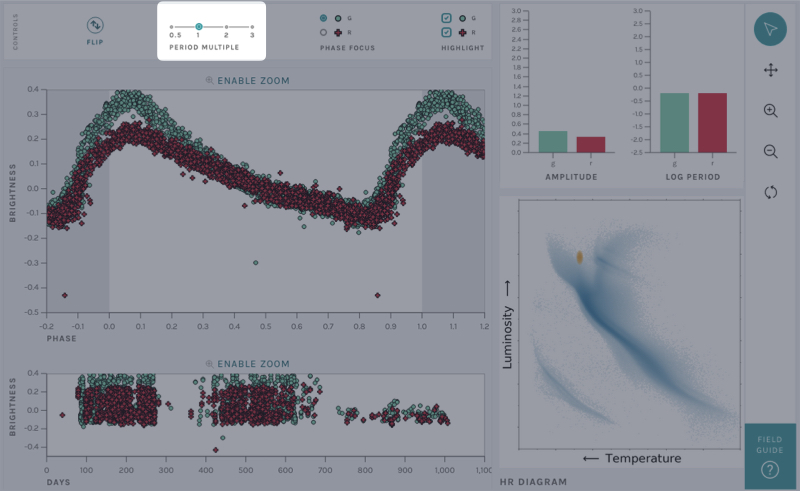
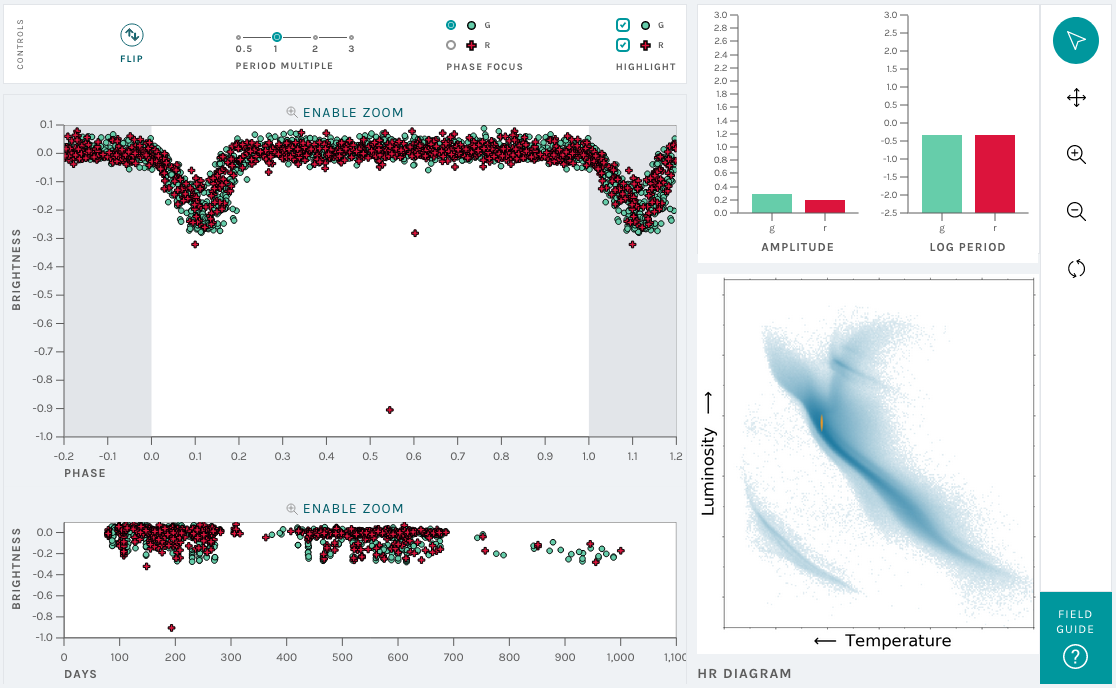
On some occasions our algorithm to identify the period of variability, does not find the correct answer, but instead finds a "harmonic" of the correct answer. When this happens the correct period is often equal to one-half, twice, or three-times the "best-fit" period. The identification of a "harmonic" as the best period is most common with eclipsing variable stars.
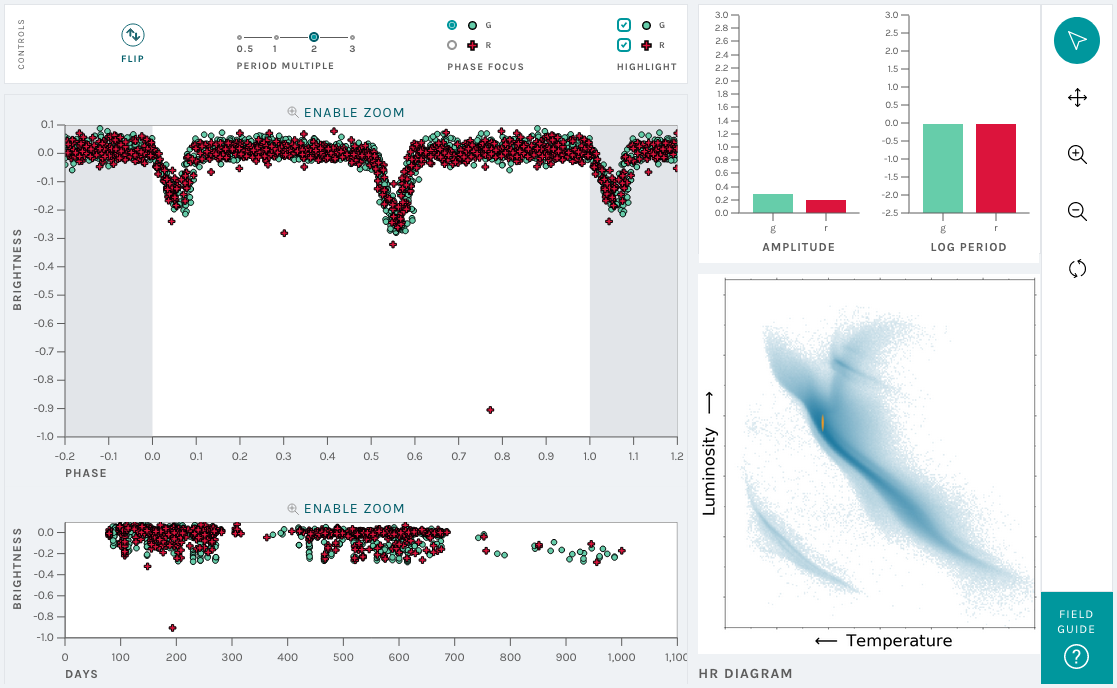
You can view harmonics of the best-fit period using the PERIOD MULTIPLE buttons in the control panel. Clicking on 0.5, 2, or 3 will re-fold the data at different values of the best-fit period. The correct period is selected when the pattern is repeated only once between a phase of 0 and 1 (i.e., the portion of the phase-folded light curve with a white background).
Below is an eclipsing binary variable, where the best-fit period is half the correct period:
Incorrect Period
PERIOD MULTIPLE = 2 (correct period)
Control Panel: PHASE FOCUS
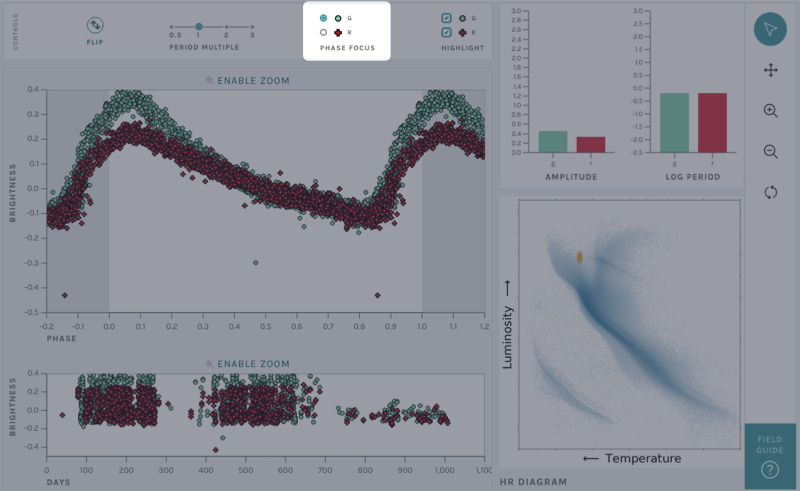
Most of the stars in this project have been observed in multiple "filters" (typically the g-band, i.e., green light, and the r-band, i.e., red light).
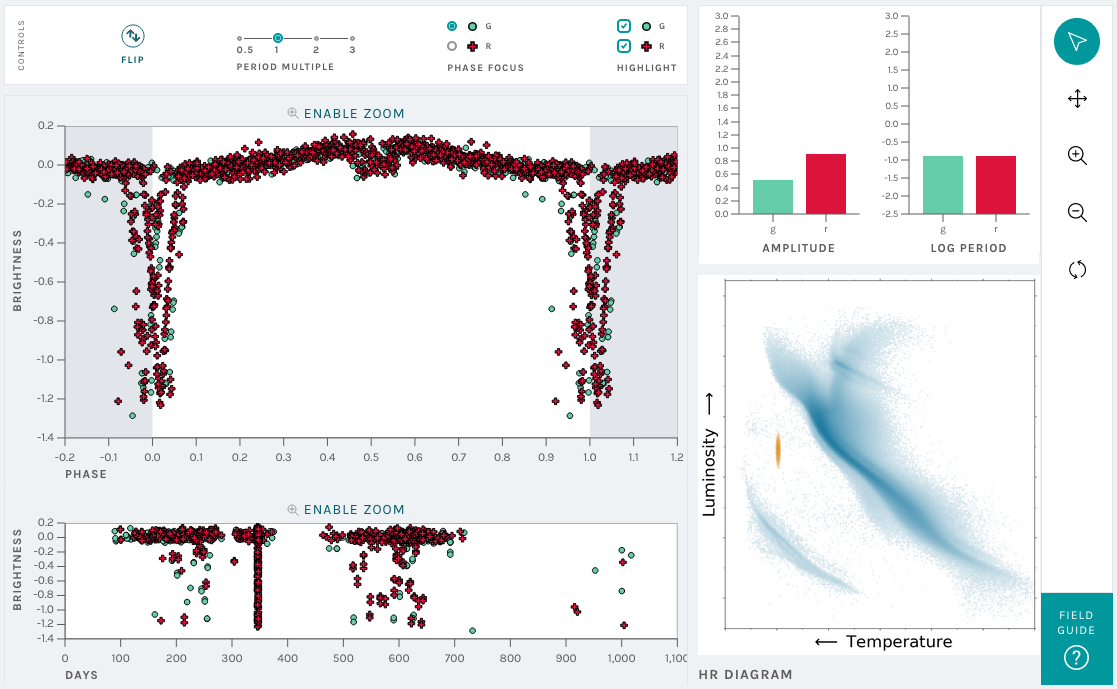
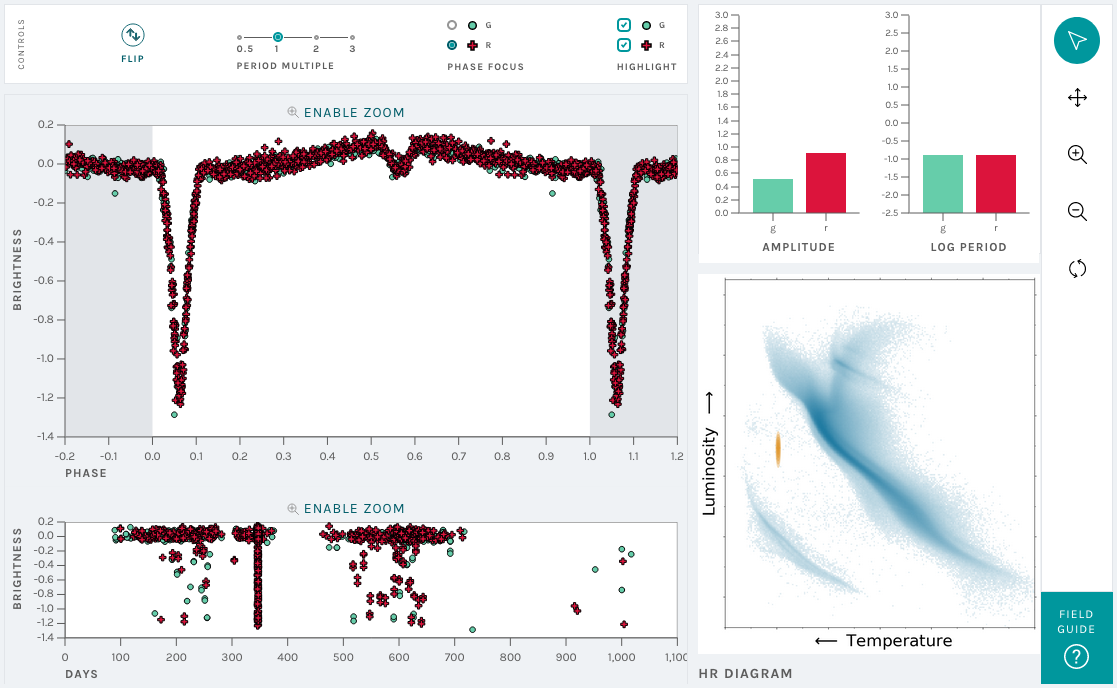
In the control panel the PHASE FOCUS buttons allow you to select a filter, and phase fold the observations on the best-fit period in that filter. In some stars it is easier to identify the period in one filter vs. the other. (If the best-fit period is nearly identical in multiple filters that is normally an extremely strong hint that the source is periodic).
Below is an eclipsing binary variable, where the best-fit period in the g band is not quite correct:
slightly Incorrect Period
Meanwhile, the best-fit period in the r band is clearly correct:
PHASE FOCUS = r (correct period)
Control Panel: FLIP
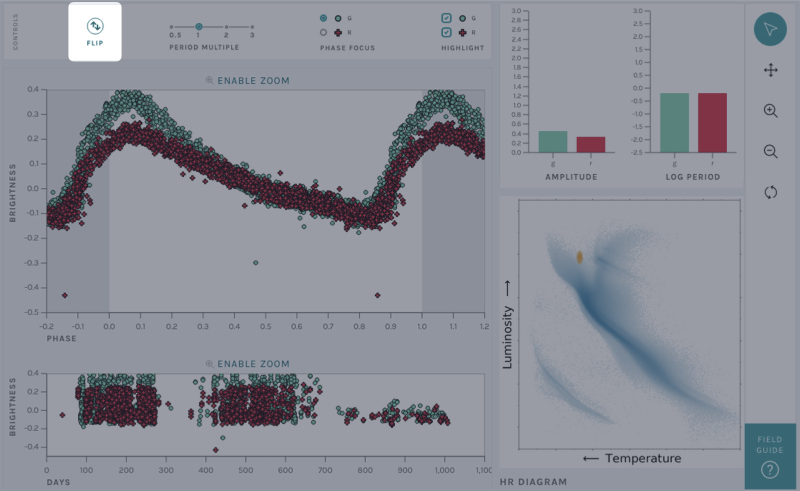
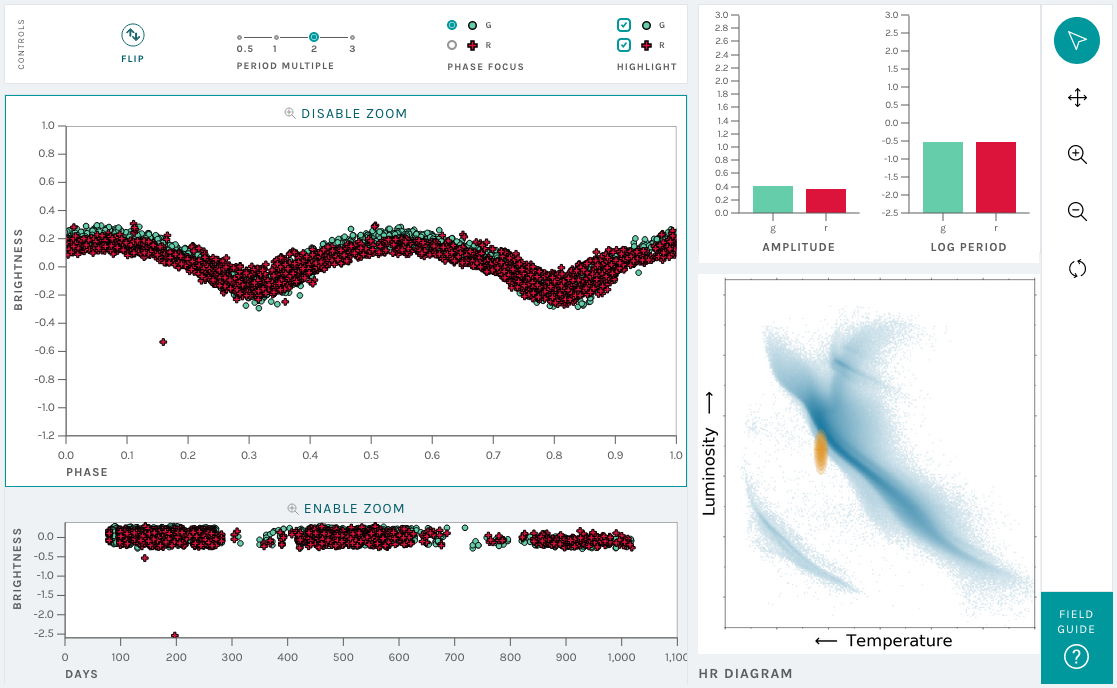
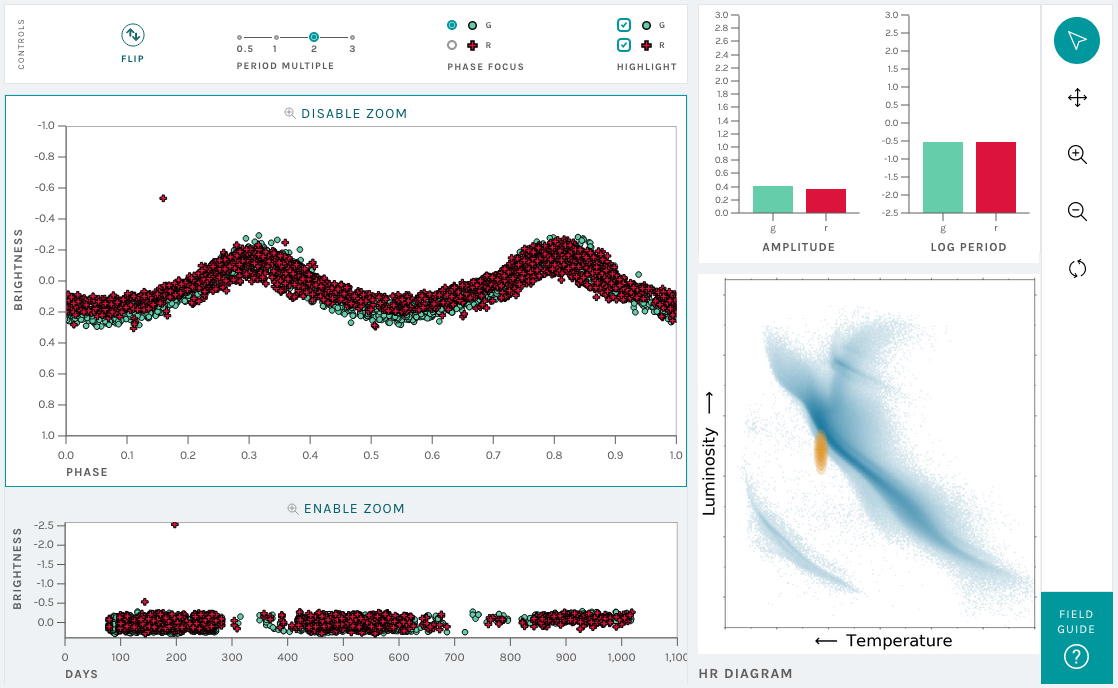
Finally, within the control panel there is a FLIP button, which will invert the brightness measurements of the light curve. This is especially useful for testing the symmetry of the periodic variations above and below the mean brightness of the star. This tool is especially handy for determining whether or not a star is an attached eclipsing binary, or W UMa variable. These stars are most typically confused with rotating stars, as both can have nearly sinusoidal light curve variations. When a rotating star's light curve is flipped, the signal will look more or less the same, whereas W UMa stars have minima that tend to be a little "sharper" than the maxima, meaning the peaks look a little different from the valleys after the light curve is flipped. (see below)
W UMa example
W UMa flipped
Control Panel: HIGHLIGHT
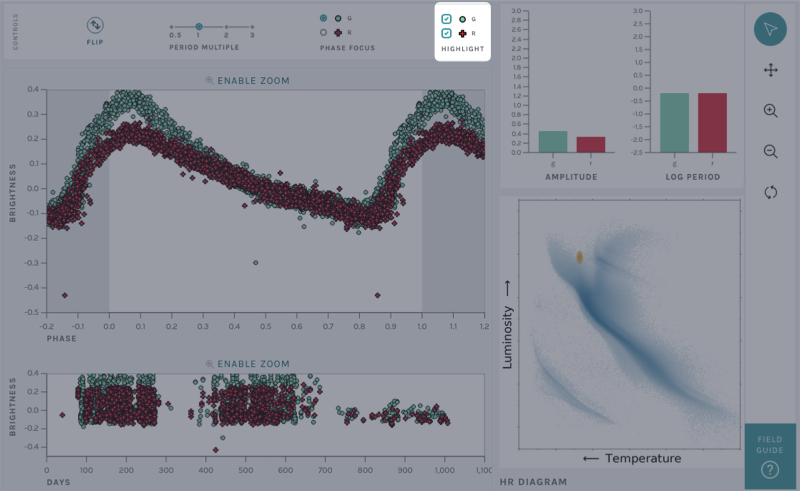
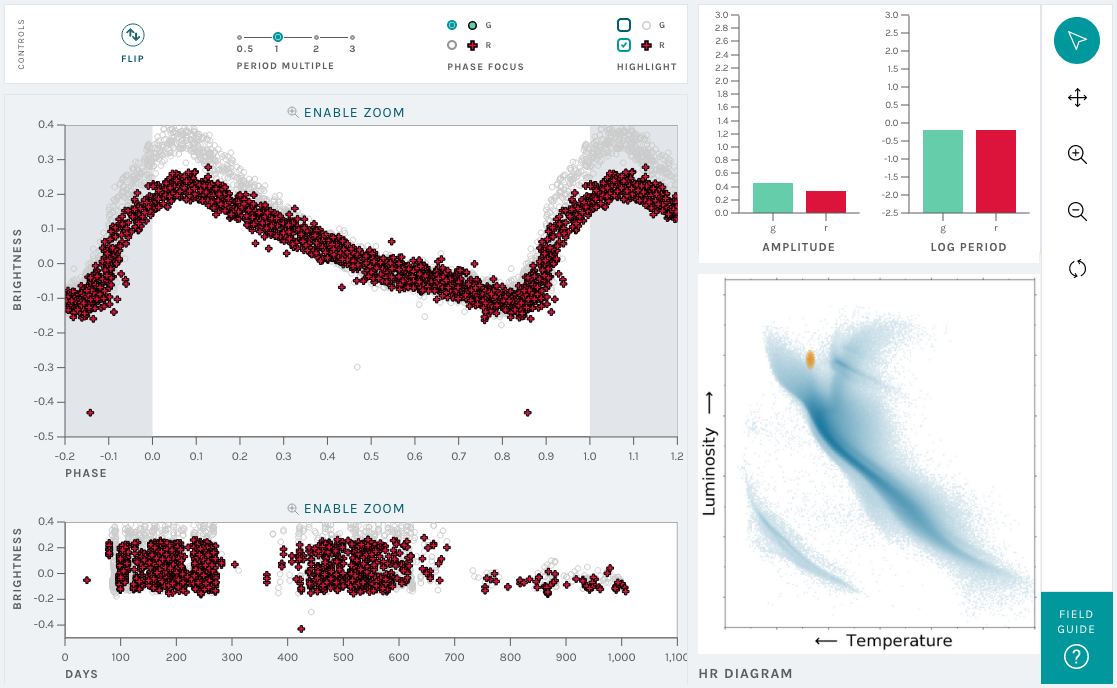
Some stars have been observed thousands of times and sometimes it can be difficult to see what's going on in the phase-folded light curve. The HIGHLIGHT buttons in the control panel give you the option to highlight specific filters in the light curve.
Below is an example where only the r-band light curve is being highlighted (the g-band observations are still shown, but they are now shown in a faint grey color):
Zoom
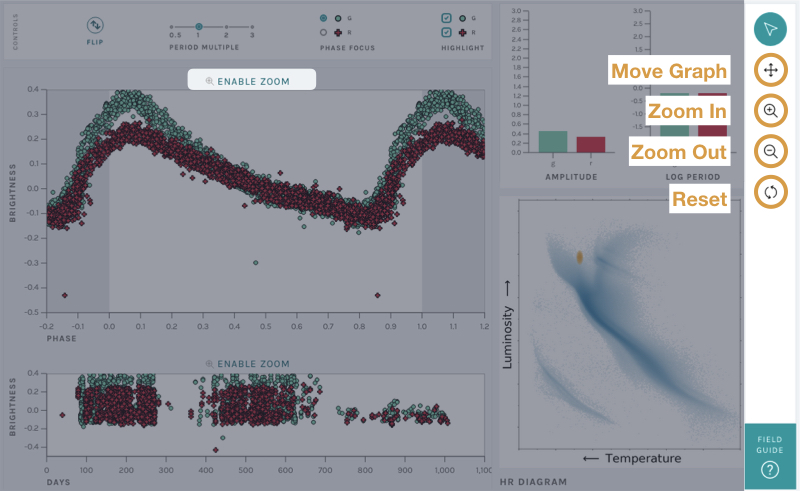
It is also possible to zoom in and zoom out on the phase-folded light curve using the ENABLE ZOOM button immediately above the phase-folded light curve plot. The zoom-in and zoom-out are controlled by the magnifying glass buttons with the + and - respectively, while the circular arrows return the plot to its original dimensions.
Other
Is it okay if I can't tell? Or get the answer wrong?
In many cases we do not know the correct classifcation for a star. That is why we need your help! The Tutorial, Field Guide, and the About sections are there to make the process easier for you to complete, and to act as reference when you are unsure of the answer. Furthermore, the beauty of Stellar Sleuths is that no one person gives the complete answer. We compile answers from many people and see if they all agree. This means it is totally okay if you make a mistake along the way.
You all seem cool, can we ask you questions?
YES! Absolutely. Check out the Talk section. Members of the Team will be checking this forum frequently to answer any questions you have about the project.